About the Authors

Ryan Maia
Ryan is currently a Green Fiscal Policy Intern at UNEP. He is also pursuing a Master in International Affairs from the Graduate Institute, Geneva. Previously, he worked at Climate XChange in Boston, Massachusetts, the Northwest Food Partners Network in Chicago, Illinois, and the Institute for Economics and Peace in Sydney, Australia. Ryan is also a Board Member for the Swiss Association of Student Organizations for Sustainability. Ryan completed his undergraduate studies at Northeastern University, where he was honored as a Presidential Global Fellow.
Himanshu Sharma
Himanshu Sharma is the Manager of the Green Fiscal Policy Network. Before joining UNEP, he worked with CNRS France, the World Bank and the OECD on public policy issues across economic policy, financial regulation and the environment. He holds a dual degree MPA from LSE and SciencesPo Paris and a MBA in International Business from BIMTECH.

Daniel Hopp
Daniel Hopp is an Associate Statistician with the Development Statistics and Information Branch (DSIB) of UNCTAD. Before joining UNCTAD in 2020, he worked in the private sector as an analyst at a private equity fund, as the head of analytics at an e-commerce start-up, and as the principal data scientist for an IoT start-up. At UNCTAD, he is trying to leverage his experience in data ecosystems, machine learning, and programming to drive innovation in the domains of trade statistics, economic forecasting, and official statistics.
Contents
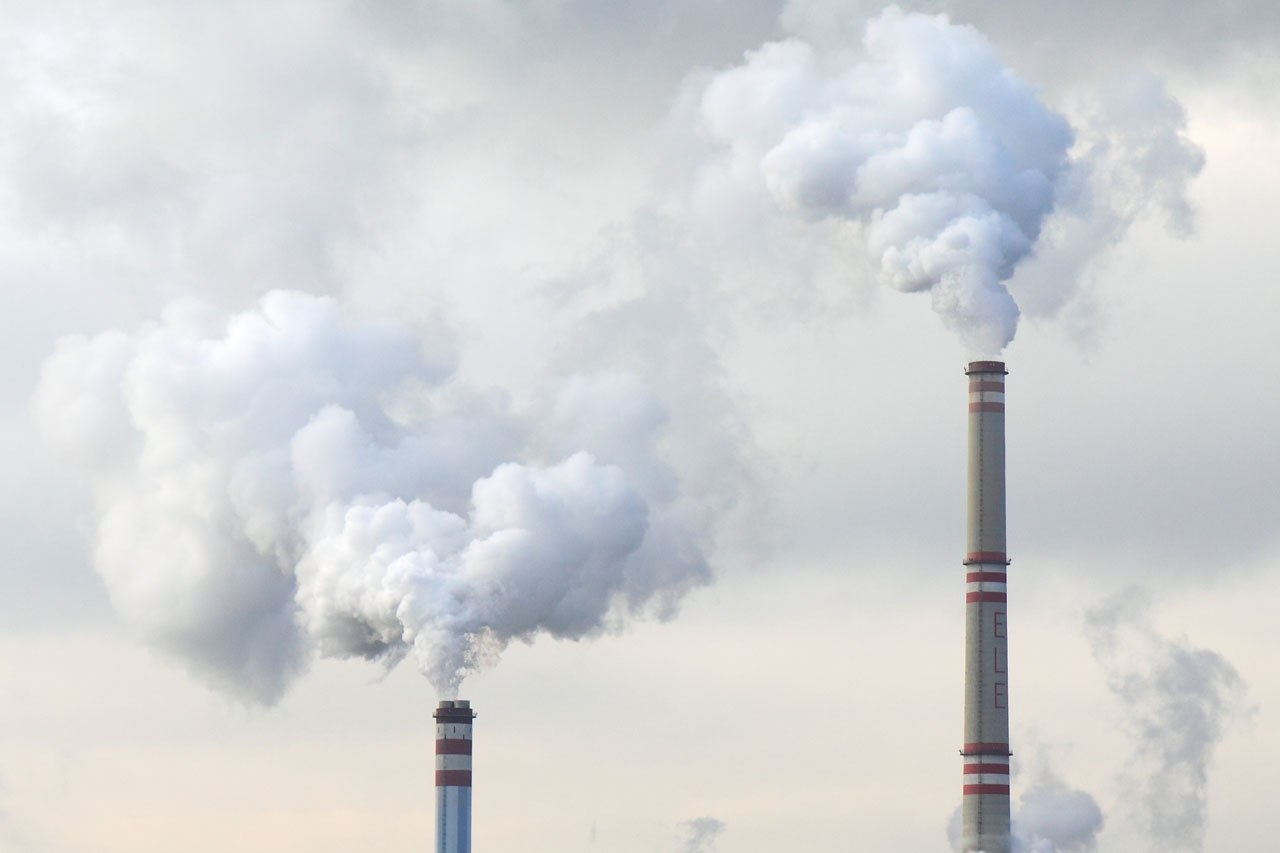
The global community is facing a trio of urgent and interlinked planetary crises: climate change, biodiversity loss, and pollution.[1] The fiscal spending policies that countries implement will play a vital role in the transition towards solving these crises and the creation of an Inclusive Green Economy. Greener government spending can ensure that, at a minimum, countries avoid spending that exacerbates these triple planetary crises and, ideally, invest in efforts that address them.
As calls, and the need for green recoveries from COVID-19 grow,[2] there is also mounting evidence that some of the most rewarding policies with regards to impact on key social and economic indicators are the very same policies that will lead us towards deep decarbonization and improvements in pollution and nature loss.[3] Fiscal policies and public finance are the most direct and impactful levers for supporting socio-economic activities today and long-term trajectories. But in most cases, national budgets are not designed using systematic analysis of socio-economic and/or environmental impacts and costs/benefits from alternative policy choices.
Informing and monitoring how governments spend public finances will be key to promoting a green, inclusive recovery. Expanding access to screening and monitoring tools will increase the transparency, accountability, and effectiveness of public spending and its impact on a sustainable future.[4] In this space, data and technology can help us transform our financial and economic decision making.[5]
Our project seeks to show how machine learning (ML) models can help policy makers and researchers design data-driven policies that most efficiently and effectively allocate scarce government resources at home and abroad to maximize inclusive and sustainable prosperity and development.
The Challenge: Public Finance Limits
There is mounting evidence that policies targeting environmental sustainability are the same ones that can underpin long-run inclusive socio-economic growth. With more than half of global GDP dependent on nature and its services, we need to reach a better understanding of how policy impacts our ecosystems and their carrying capacities.[6]
However, public finance is finite. During the COVID crisis especially, government spending priorities have been stretched thin by rescue and recovery stimulus efforts. For policy- and decision-makers in many countries, one of the key impediments to designing well-targeted green transition policies is a lack of data and intelligence on the causal chains from a policy to its impact on society, the economy, and the environment. It is difficult to manage and prioritize green spending if you can’t measure its effects.
The Solution: Machine Learning to Forecast Green Spending Impacts
Properly trained machine learning (ML) models can enable rapid, quantitative predictions of policy impacts. Combining advanced statistics, good quality data, and processing power allows ML models to find patterns that connect inputs and outputs.[7] Such models are ideally suited for cases when there is no clear definition and direct discernable connection between inputs and outputs.[8]
Despite its potential, the impact of ML in the field of economic policy has been largely exploratory in nature thus far.[9] However, ML modelling is within the grasp of researchers and policy makers without data science expertise thanks to the development of simple to use, open-source libraries. For example, UN Conference on Trade and Development (UNCTAD) recently produced a study nowcasting international trade using an artificial neural network, accompanied by publicly available Python and R libraries.[10]
If governments integrate ML modelling into their budgeting and statistical processes, they can build powerful models capable of accurately forecasting the impact of their spending decisions. Over time, with more data and training, these ML models will become better at identifying causal mechanisms, thus providing more accurate predictions and guidance. Accurate impact forecasting will allow governments to confidently allocate spending in ways that promote specific sustainability outcomes.
This exploratory research venture between the UN Environment Program (UNEP) and UNCTAD showcases how machine learning has the potential to transform the measurement of policy impacts on Sustainable Development Goals (SDGs), Nationally Determined Contributions (NDCs) and National Biodiversity Strategies and Action Plans (NBSAPs) and enable targeted and efficient decision making for underpinning green and inclusive transitions.
Machine Learning 101: How It Works and Models We Used
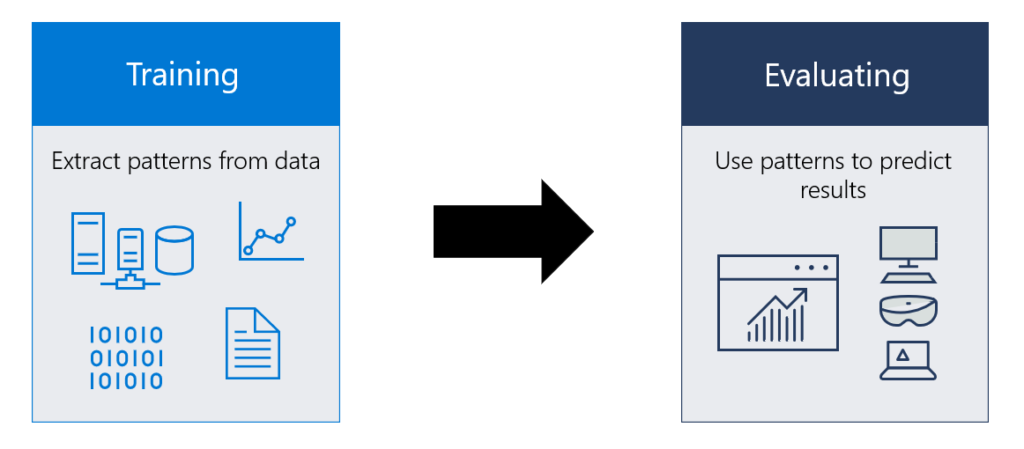
A supervised machine learning model is an algorithm that can be trained or fit on input data to obtain predictions for a target variable(s). An essential characteristic of machine learning models is their ability to recognize patterns in data without direct programming input. Generally, the more data available, both in terms of observations and features, the stronger its predictive power.
After training a machine learning (ML) model, it can be given new, unseen data to evaluate itself against. The predictions that the model creates in response to this testing data are then compared to the actual values of the target variable to assess model performance. This evaluation on unseen data ensures the generalizability of a model, and thus its utility in generating predictions on novel data into the future.
We trained and evaluated five different types of ML models for this project: Artificial Neural Networks (ANNs), Long Short-Term Memory Networks (LSTMs), Gradient Boost Models (GBMs), Ordinary Least Squares Regression (OLS) models, and Random Forest (RF) models.

Artificial Neural Networks (ANNs) are an extremely popular and well-performing methodology in machine learning, proving themselves especially useful in applications such as image recognition and autonomous driving. They are made up of various interconnected layers composed of groups of nodes. Data are passed through the network and multiplied by coefficients or weights before each new layer. The weighted sum of these values for each node are then passed to the next layer after passing through an activation function before a prediction is finally obtained. This prediction is then compared with the actual value of the target variable and used to update the weights of the network to reduce the difference between the predicted and actual value. When this process is complete, the network is considered trained and can be used to generate predictions on new data. A simple feed-forward ANN with an input, one hidden, and one output layer is illustrated above. More information on ANNs can be found here.
Long Short-Term Memory Networks (LSTMs) are a derivative of feed-forward ANNs where an element of time is introduced. This makes them more suitable for use with data such as economic time series.[11]
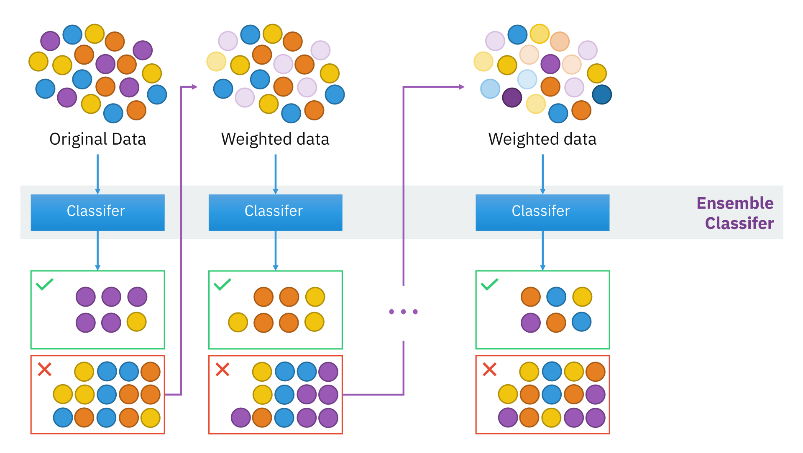
Gradient Boost Models (GBMs) are a family of powerful machine-learning techniques successful in a wide range of practical applications.[12] Some common approaches to ML modeling, such as random forests, take an “ensemble approach” – a large number of relatively weak simple models are combined to obtain a stronger prediction.[13]
Rather than simply averaging models in an ensemble, boosting methods of ML take a constructive approach to creating an ensemble. New models are added to the ensemble sequentially, and at each particular iteration, a new, weak, base-learner model is trained using the learned error of the whole ensemble so far.[14] Artificial neural networks (ANNs) remember data patterns in the model’s connections between artificial neurons; in boosted ensembles, however, the base-learners play the role of the memory medium. Base-learners in boosted models remember and shape data patterns sequentially, gradually increasing the level of pattern detail.[15]
Gradient boosting decision trees incorporate the constructive ensemble approach of boosted modeling, taking the simple decision tree as its base model. They also correlate each new base-learner model with the negative gradient of the ensemble’s loss function. This consecutive fitting of each new model provides a more accurate estimate of the response variable.[16]
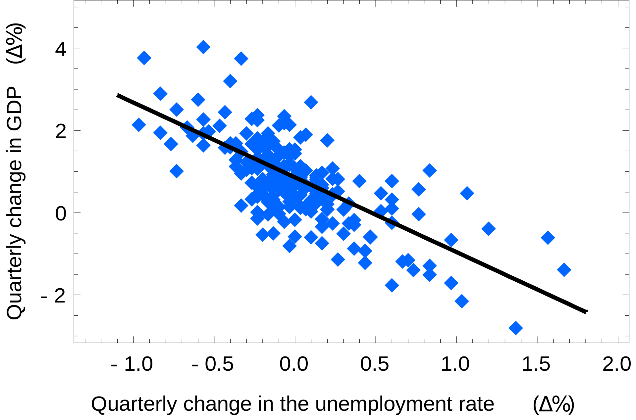
Ordinary least squares regression (OLS) estimates the relationship between independent variables and a dependent variable by minimizing the total squared error (i.e. the sum of the squares in the difference between the observed and predicted values of the dependent variable). OLS produces the one straight line that minimizes the total squared error.[17]
Though not traditionally considered a machine learning algorithm, OLS results were included in this case study as a point of reference for the other methodologies’ performance.
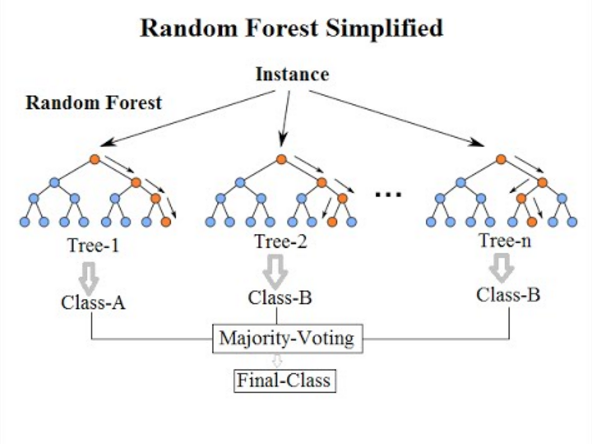
Random forest models consist of a large number of individual decision trees that operate as an ensemble. Decision trees identify features of the data that split the observations in such a way that (a) the resulting groups are as different from each other as possible, and (b) the members of each resulting group are as similar to each other as possible. See the illustration below for an example of how a decision tree works.
Example of a decision tree classifying a sample set of observations
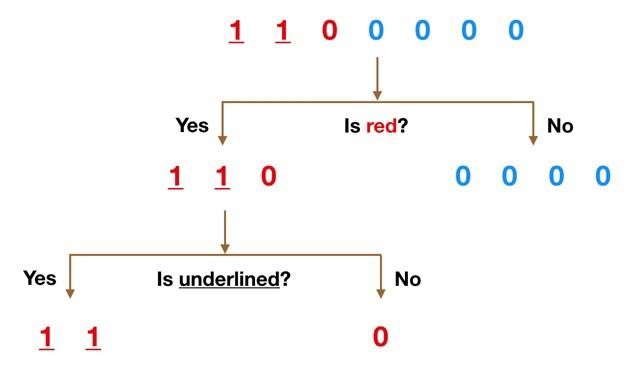
Example from Towards Data Science
In a Random Forest model, each individual decision tree in the Random Forest produces a prediction. The prediction with the most votes then becomes the model’s prediction. [18]
The strength of the Random Forest model is the fact that the decision trees within the Random Forest are uncorrelated. While some trees may be wrong, many other trees will be right, so as a group the trees are able to move in the correct direction. The chances of making correct predictions increase with the number of uncorrelated trees in our model.[19]
Random Forest models can work on large datasets with high dimensionality. They can also handle missing values in datasets.[20] Applications of Random Forest models include credit card fraud detection, breast cancer prediction, stock market sentiment analysis, and price optimization.[21]
Project Design: Four Key Considerations
When designing this ML application, we took into account four key factors. These factors concern both the feasibility and value-add of using ML to predict environmental outcomes.
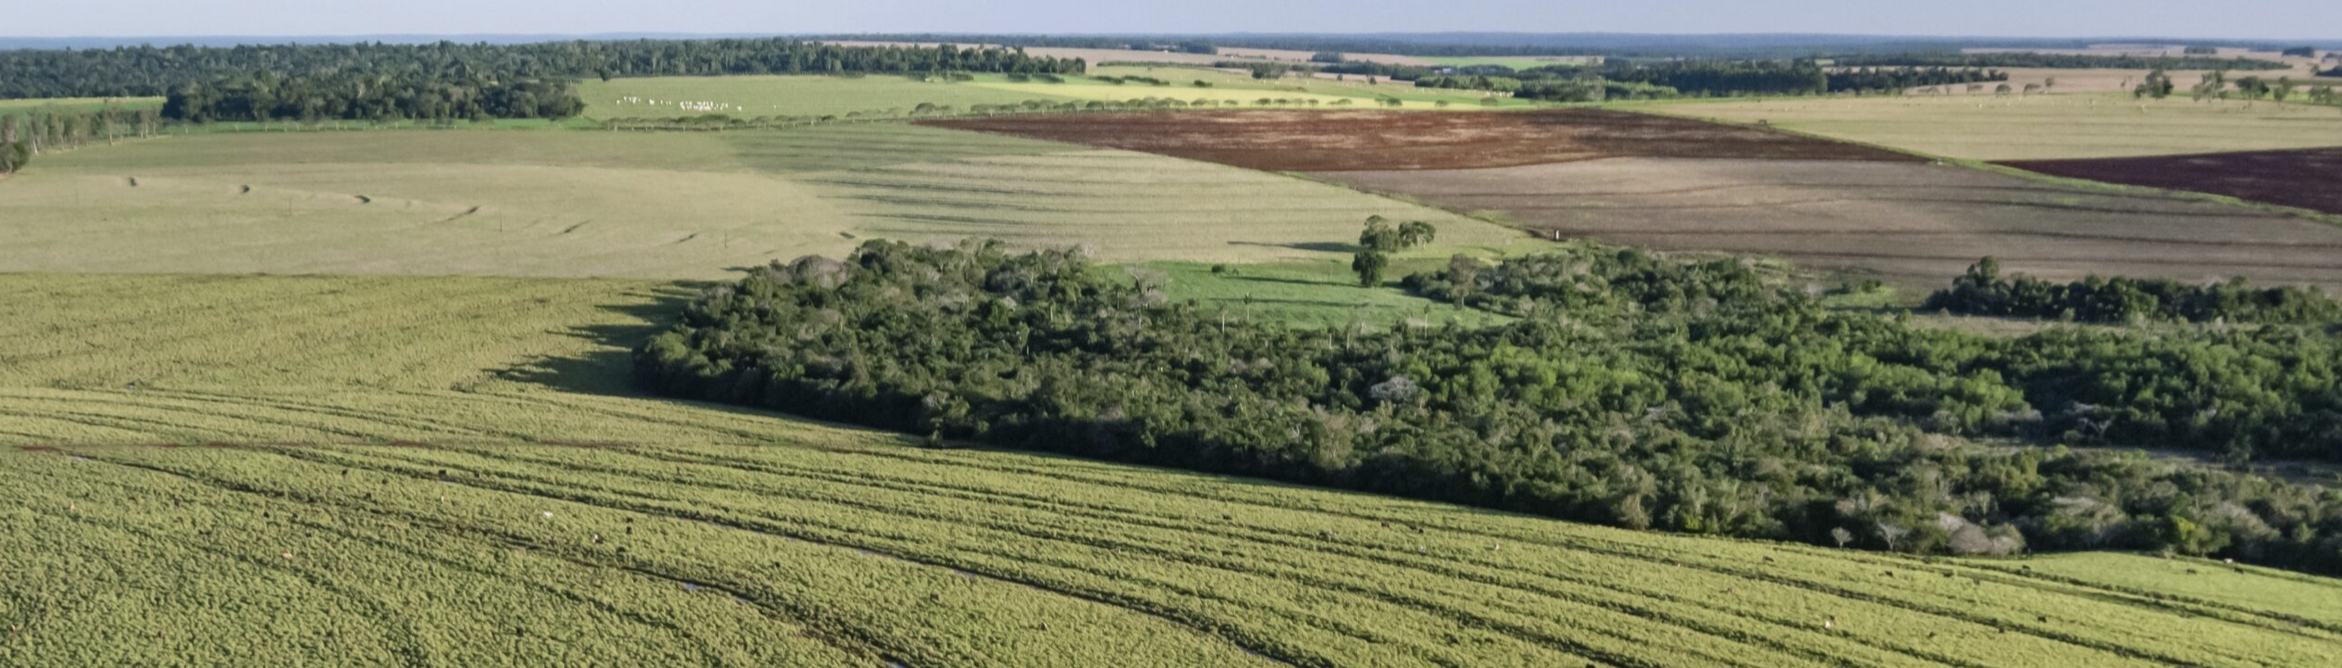
Unsustainable economic practices are causing our planet to suffer biodiversity loss, rising pollution, and climate change. Deforestation is a particularly grave environmental concern, given the critical role forests play in both harboring biodiverse ecosystems and mitigating climate change via carbon sequestration.
There are innumerable factors that can affect the environment, particularly when it comes to finance. However, if there is a strong enough relationship between a set of input variables and a target variable, a properly trained Machine Learning model will be able to detect that signal.
Our theory of change assumes that sizable Official Development Assistance (ODA, i.e. development aid) inflows to countries with high ODA to GDP ratio will have a sizable effect on deforestation, such that this signal will be detectable and predictable by an ML model. This conceptualization is supported by the idea that indebted countries have a greater likelihood to turn to natural capital exploitation as a fiscal buffer.
Public finance is finite. During the COVID crisis especially, government spending priorities have been stretched thin by rescue and recovery stimulus efforts. Our project seeks to show how ML models can help policy makers and researchers design data-driven policies that allocate precious government resources at home and abroad.
The more data ML models are trained with, the more predictive power they tend to have. In addition, the predictive strength and value of an ML model can only be assessed if there is enough data to both train the model on some of the data and test the model on the remaining data. This means our project should use input and output datasets that go back sufficiently far.
Input Data Descriptiveness. To predict the relationship between environmental spending and environmental impact, we needed spending data that was environmentally descriptive (i.e. disaggregated) in some way. Since the Rio Conventions were signed at the 1992 Conference on Environment and Development, the Development Assistance Committee (DAC) of the Organization for Economic Co-operation and Development (OECD) has set up the Rio markers system, consisting of policy markers to monitor and statistically report on development finance flows targeting environmental themes.[23]
Government Spending Input Data. The OECD has various public timeseries datasets on ODA. For our modelling needs, two ODA datasets stood out:
- The ODA by sector[24] dataset features annual bilateral ODA commitments (disaggregated by sector, donor, and recipient) for 2005 – 2019.
- The Aid activities targeting Global Environmental Objectives[25] dataset features bilateral ODA commitments (disaggregated by Rio Marker type, Rio Marker score, donor, and recipient) for 2002 – 2019.
Environmental Output Data. To use annual government spending data as an input, we require environmental output data that dates back just as far. The Global Forest Watch[26] dataset fits this bill, featuring year-on-year measurements of tree cover loss for 2001 – 2020.
Country Case Studies
We created illustrative models and analyses for six countries. These countries were selected based on their forest cover loss rates, Official Development Assistance (ODA) to Gross National Income (GNI) ratios, and machine learning (ML) model error.
For each country, the yearly growth rate of deforestation was taken as the target variable. Three different sets of explanatory variables were used to fit models and compare performance: yearly ODA growth disaggregated by sector, disaggregated by Principal Rio Marker, and these two datasets combined. The five machine learning methodologies mentioned above were then employed to train models on data dating from 2005-2015 and test models on data from 2016-2019.
ZAMBIA
Deforestation
Biodiversity and natural resources in Zambia majorly contribute to the provision of ecosystem goods and services for national economic development and livelihoods.[27] This is especially the case for the 68% of Zambia’s population living below the poverty line, and who depend on natural ecosystems for energy, farmland, and food.[28] The overall contribution of forests to the country’s 2010 GDP was estimated to be at least 6.3% or USD 1 252 million.[29]
Click on the button to load the content from datawrapper.dwcdn.net.
As of 2013, about 66% of Zambia’s land was under forest cover.[30] Zambia’s forests have been vulnerable to factors such as shifting agricultural land use, slash-and-burn techniques, increasing demands for wood-based energy, unsustainable commercial use of indigenous tree species, overgrazing, and forest fires.[31] In 2010, tree cover extended over 30% of Zambia’s land area.[32] Between 2001 and 2020, Zambia lost 7.8% of its tree cover or 1.87Mha, equivalent to 690Mt of CO2 emissions.[33] Recent estimates placed the country fourth globally for having the largest deforested area.[34]
In 2018, with the support of the World Bank, the Government of Zambia launched a 33 USD million forest landscape program intended to improve sustainable land management, diversify livelihoods options available to rural commodities, including climate-smart agriculture and forest-based livelihoods, and reduce deforestation.[35] Delivering climate-smart agriculture technologies that boost productivity, improve resilience and reduce emissions to farmers is a key feature of the program.[36] Similarly, USAID’s Community-Based Forest Management activity in Zambia is supporting the Zambian Government in the development of a national Reducing Emissions from Deforestation and Degradation strategy.[37]
Official Development Assistance (ODA)
Hypothetically, a higher Official Development Assistance (ODA) to Gross National Income (GNI) ratio suggests that ODA will have a stronger influence on economic activity and its externalities – such as deforestation. Since 2007, Zambia’s ODA to GNI ratio has dipped below the low-income country average. It has hovered around 5% of GNI since 2010.
Click on the button to load the content from datawrapper.dwcdn.net.
Machine Learning
The graph below shows the modelling results of a gradient boosted decision trees algorithm, trained on yearly ODA growth disaggregated by both sector and Principal Rio Marker.
In Zambia’s ML model, the lines are relatively closely aligned, suggesting that the model is capable of producing fairly accurate predictions on unseen data. The biggest exception is 2019, where the model predicted a slight increase in deforestation, whereas in actuality the rate increased slightly.
Notably, the model is able to predict a rise in the rate of tree cover loss in 2016 as well as a relative decline over the remaining period. The ability of the model to track this trend suggests it could take hypothetical ODA inputs and transform them into informative predictions – a very useful quality for policymakers.
- The y-axis shows the annual growth rate of deforestation.
- The green line represents the actual observed growth rate of deforestation during the training period.
- The solid orange line represents observed levels of growth in deforestation (i.e. tree cover loss) during the test period.
- The dotted orange line tracks the model’s predictions of growth in deforestation rates.
Key Focus: The closer the dotted orange line is to the solid orange line, the better the model was able to predict growth in deforestation using ODA data.
Click on the button to load the content from datawrapper.dwcdn.net.
HAITI
Deforestation
The Caribbean is an internationally recognized biodiversity hotspot and one of the world’s greatest centers of endemic biodiversity as a result of the region’s geography and climate.[38] Haiti is one of the richest countries in the Caribbean in terms of botanical diversity. Haiti boasts a rich fauna as well, of which 75% are considered endemic.[39]
Unfortunately, Haiti has experienced dramatic deforestation for centuries. When first treaded by European colonizers in the 15th century, trees covered three quarters of the land.[40] Under Spanish control, Haiti’s forests were used to export lumber. Under the French, forests were razed to create lucrative sugar cane plantations.[41] Since 2001, Haiti has lost 8.4% of it tree cover.[42] The other half of the island of Hispaniola – the Dominican Republic – is verdant with forest cover, evidence of the two countries’ divergent colonial histories and legacies.
Click on the button to load the content from datawrapper.dwcdn.net.
The greatest cause of deforestation in Haiti has been the demand for fuelwood. [43] Woodfuels constitute nearly 80% of Haiti’s primary energy supply.[44] Haiti lacks the proper infrastructure to deliver electricity to its population, forcing a reliance on wood fuel.[45] Around sixty percent of rural Haitians rely on agriculture for their livelihoods.[46] Approximately 60–65% of rural landholdings lack any type of documentation recognized by formal law, a disincentive for farmers to prioritize sustainable land stewardship.[47] While the Haitian government has identified 35 protected areas covering 6% of the country, no more than 0.5% of the country’s area is being effectively protected.[48]
Healthy, properly functioning ecosystems are more resilient to weather events. If the effects of climate change become exacerbated and Haiti’s natural capital continues to deteriorate, the country will not only experience weather events of increased frequency and severity, but also be further exposed to the human security risks those events present.[49]
Official Development Assistance (ODA)
In 2010, Haiti was struck by a large-scale, magnitude 7.0 earthquake, followed by two magnitude 5.9 and 5.5 aftershocks. Three million people (nearly one-third of the country’s population) was affected, and over one million were left homeless.[50] Haiti experienced a spike in international aid in 2010, as visualized below.
Click on the button to load the content from datawrapper.dwcdn.net.
Machine Learning
Haiti was an interesting modelling case due to a large spike in forest cover loss in 2016. That year, Hurricane Matthew – the first Category 5 Atlantic storm since 2007 – struck Haiti, killing over 500 people and causing almost 2 million USD in damages.[51] Using ODA as an input, it is understandably difficult for any model to know that an extreme, nature-induced deforestation event would occur. As such, each ML model for Haiti showed a high degree of error with its 2016 prediction.
However, while the gradient boosted decision trees method using sector disaggregated ODA as an input overestimated the rate of deforestation growth after 2016, it was able to capture the trend in deforestation rates. If training data were expanded to include 2016, the model may have been better able to recalibrate for anomalous 2016 rates. While the model demonstrated a relatively higher degree of error compared to models for other countries, it tracked year-on-year increases and decreases in deforestation rates. This model could be used to help policymakers determine how to increase or reallocate sectoral ODA in a way that maximally reduces forest cover loss rates.
- The y-axis shows the annual growth rate of deforestation.
- The green line represents the actual observed growth rate of deforestation during the training period.
- The solid orange line represents observed levels of growth in deforestation (i.e. tree cover loss) during the test period.
- The dotted orange line tracks the model’s predictions of growth in deforestation rates.
Key Focus: The closer the dotted orange line is to the solid orange line, the better the model was able to predict growth in deforestation using ODA data.
Click on the button to load the content from datawrapper.dwcdn.net.
DEMOCRATIC REPUBLIC OF THE CONGO
Deforestation
Environmentally, the DRC is home to more than half of the forest resources in Africa, in addition to being the most biodiverse country on the continent.[52] These factors make the DRC a custodian of critical global ecosystem services.
Click on the button to load the content from datawrapper.dwcdn.net.
Globally, agricultural and forestry trade drives a large share of tropical deforestation emissions.[53] Research suggests that agriculture is the main driver of deforestation in the DRC.[54] However, it is important to note that there is a lack of strong evidence to show the magnitude of this threat.[55]
Deforestation in the DRC has also arisen from fuelwood consumption, artisanal logging, and industrial timber trade. At the peak of the country’s recent period of conflict, the DRC was losing the equivalent of 89 hectares of forest each day due to illegal fuelwood harvesting.[56]
Official Development Assistance (ODA)
Economically, the DRC requires and receives significant ODA. About three out of every four people live below the poverty line, and the country has the lowest Human Development Index score in the world.[57] As of 2019, the DRC was the world’s 8th top net recipient of ODA[58] and the 4th top net recipient in Africa.[59] Agriculture accounts for 60% of jobs and 18% of GDP in the DRC.[60] Additionally, one in three people in the country are estimated to be affected by high acute food insecurity, making the DRC home to the highest number of people in urgent need of food security assistance in the world.[61]
Click on the button to load the content from datawrapper.dwcdn.net.
Machine Learning
Sector-disaggregated ODA data for the Democratic Republic of the Congo demonstrated strong predictive potential for 2016 and 2019 when used to train an LSTM model, with 2017 and 2018 relatively over and under-estimated, respectively. In addition, the model was able to predict a steep downward trend in the growth rate of tree cover loss.
Policymakers and researchers could use this model to not only predict how ODA will influence tree cover loss rates relative to past years, but also to create a potential forecast of the rate of forest cover loss that would result from a given ODA distribution.
- The y-axis shows the annual growth rate of deforestation.
- The green line represents the actual observed growth rate of deforestation during the training period.
- The solid orange line represents observed levels of growth in deforestation (i.e. tree cover loss) during the test period.
- The dotted orange line tracks the model’s predictions of growth in deforestation rates.
Key Focus: The closer the dotted orange line is to the solid orange line, the better the model was able to predict growth in deforestation using ODA data.
Click on the button to load the content from datawrapper.dwcdn.net.
SOLOMON ISLANDS
Deforestation
Biodiversity in the Solomon Islands is of global importance. The country has been recognized as a “Center of Plant Diversity,” with over 4,000 species of plants, 3,200 of which are indigenous.[62] The islands are also home to diverse bird, mammal, and fish species.[63] 85% of the country’s population is rural, and biodiversity provides key sources of revenue, alimentation, and health.[64] Ecosystem services in the country also play a large role preventing extreme natural events, such as flash floods.[65]
Click on the button to load the content from datawrapper.dwcdn.net.
In 2010, 96% natural forest extended over 96% of the Solomon Islands. But since 2001, the country has lost 7% of its tree cover.[66] Among the main threats to the country’s forests and biodiversity are logging, unsustainable land use, mining, and population growth. Commercially speaking, industrial logging and monoculture plantations of oil palm, coconut, and cocoa are driving large-scale deforestation.[67] The Solomon Islands is the second biggest exporter of round logs to China, and the country’s economy is largely dependent on timber exports[68]; as of 2019, logging companies were clearing the country’s forests at nearly 20 times the sustainable rate.[69] In addition to biodiversity and ecosystems services loss, deforestation is causing excessive soil erosion, silting of rivers and degradation of adjacent coral reefs.[70] The legal process to safeguard land from logging is both complex and costly, particularly in rural areas.[71]
The Solomon Islands joined the UN Program on Reducing Emissions from Deforestation and Forest Degradation (UN REDD Program) in 2010 and received a 550,000 USD grant to develop a national REDD+ program.[72] However, the national REDD+ program lasted less than 3 years (2011-2014) and is now closed.[73] A REDD+ Forest Conservation in Pacific Island Countries project, commissioned by the German Federal Ministry of the Environment, Nature Conservation and Nuclear Safety, sought to provide new knowledge and skills to help guide a forest inventory piloting and capacity building program that included over 50 forestry officers, university staff, students and community members.[74] The Solomon Islands is implementing a National Forest Inventory with the support of The Pacific Community and German Development Cooperation.[75]
Official Development Assistance (ODA)
The Solomon Islands has experienced a higher ODA to GNI ratio than most low-income countries since 2003. However, this ratio has tapered substantially between 2010 and 2019, falling from over 40% to below 15%. Australia is the Solomon Islands’ largest bilateral donor.[76]
Click on the button to load the content from datawrapper.dwcdn.net.
Machine Learning
The LSTM model using sector-disaggregated ODA data for the Solomon Islands demonstrated very low error rates for 2016 and 2017 along with a strong ability to track year-on-year trends in forest cover loss rates.
Notably, each LSTM model and almost all of the other ML models overestimated tree cover loss in 2018 and 2019. This could be the result of a causal factor that is not currently present or detectable in the ODA input data. With more time and data, it would be interesting to see if the LSTM or other ML models are able to detect and respond to this signal.
- The y-axis shows the annual growth rate of deforestation.
- The green line represents the actual observed growth rate of deforestation during the training period.
- The solid orange line represents observed levels of growth in deforestation (i.e. tree cover loss) during the test period.
- The dotted orange line tracks the model’s predictions of growth in deforestation rates.
Key Focus: The closer the dotted orange line is to the solid orange line, the better the model was able to predict growth in deforestation using ODA data.
Click on the button to load the content from datawrapper.dwcdn.net.
LIBERIA
Deforestation
As part of both the Guinean Forests and the West Africa Biodiversity Hotspot, Liberia contains most of the remaining tropical forest in West Africa. Natural forest covered over 9 million hectares, or 97%, of Liberia in 2010. However, between 2001 and 2020, the country has lost almost 2 million hectares of tree cover, a 20% decrease equivalent to 1.03 gigatons of CO2 emissions. Since 2013, deforestation has claimed 1.5-2.5% of Liberia’s tree cover each year.
Click on the button to load the content from datawrapper.dwcdn.net.
Liberia’s forests, like the rest of the Upper Guinea forest, are under pressure from commercial agriculture and mining.[77] Biodiverse areas of western Liberia are particularly threated by deforestation, resultant from both mining operations (plus the road construction that accompanies them) and logging.[78][79] Around half the land in Liberia has been allocated for logging, agriculture, mining and conservation.[80] Liberia’s economy is largely dependent on extractive industries,[81] and natural resources are thus central to its current economic growth; however, sustainable use of them is key to the country’s long-term prosperity.[82]
Liberia made a zero-deforestation commitment and entered a partnership for REDD+ and agricultural development in 2014,[83] but efforts aimed at building the reference level are still ongoing.[84] While Liberia has signed a voluntary partnership agreement (VPA) with the EU intended to improve timber traceability and forest governance,[85] the process is slow to create change in practice.[86]
Official Development Assistance (ODA)
The ODA to GNI ratio in Liberia illustrates that ODA has comprised a substantial portion of the country’s public finance allocations. Since 2003, Liberia has dramatically exceeded the average ODA to GNI ratio among low-income countries.
Click on the button to load the content from datawrapper.dwcdn.net.
Two violent civil wars in Liberia killed a quarter million people between 1989 and 2003 and destroyed the West African country’s economy.[87] A massive influx of foreign aid followed that turmoil. In large part due to the foreign aid influx, Liberia’s GDP ballooned from $748 million in 2003 to $3.3 billion in 2017.[88] However, this ratio has dipped steeply since 2011.
Machine Learning
The LSTM model performed exceptionally well in Liberia when taking sector-disaggregated ODA as an input. Error in the model’s predictions on the test data subset are very low, allowing the model to predict an increase in tree cover loss rates in 2017 as well as a subsequent decline in following years.
There is a strong potential for this model to be considered in ODA decision making for Liberia. Officials in Liberia could use this model as scientific grounds to advocate for aid packages that prioritize certain sectors. Donor countries interested in the preservation of Liberia’s vital natural capital could take this model into account when assessing which sectors to support via ODA.
- The y-axis shows the annual growth rate of deforestation.
- The green line represents the actual observed growth rate of deforestation during the training period.
- The solid orange line represents observed levels of growth in deforestation (i.e. tree cover loss) during the test period.
- The dotted orange line tracks the model’s predictions of growth in deforestation rates.
Key Focus: The closer the dotted orange line is to the solid orange line, the better the model was able to predict growth in deforestation using ODA data.
Click on the button to load the content from datawrapper.dwcdn.net.
MADAGASCAR
Deforestation
Madagascar is a renowned biodiversity hotspot. Between 80 and 90% of the animal and plant species in Madagascar are exclusive to the country.[89] The country is also a large carbon sink, with over 16 million hectares of tree cover.[90] However, between 2001 and 2020, Madascar has lost 4.13Mha of tree cover – almost a quarter of its total tree cover, and about 1% of global total tree coverage.[91] This loss in carbon capture is equivalent to about 2.02Gt of CO2 emissions.[92] A 2020 study found that, by 2070,the combined effects of deforestation and anthropogenic climate change could eliminate the entirety of Madagascar’s eastern rainforest.[93]
Click on the button to load the content from datawrapper.dwcdn.net.
Agriculture has been the primary driver of deforestation in Madagascar for two decades.[94] As a result of a booming population, agricultural production has been prioritized over environmental protection, leading to the rapid conversion of forested areas into agricultural land.[95] The government has attempted to discourage deforestation through taxation and regulations. However, this has not only been unsuccessful, but further impoverished farmers.[96] In many cases, poor farmers have no choice other than to use unsustainable (but affordable) farming methods, such as slash and burn techniques. The fact that most poor farmers do not own the land they farm is further disincentives ecosystem stewardship.[97]
Official Development Assistance (ODA)
Despite having considerable natural resources, Madagascar has among the highest poverty rates in the world.[98] Madagascar is also one of the African countries most severely affected by climate change impacts, experiencing an average of three cyclones per year.[99]
Madagascar’s ODA to GNI ratio spiked at 25% in 2004 and has hovered around 5% since 2009. While this is below the average among low-income countries, it is still substantial.
Click on the button to load the content from datawrapper.dwcdn.net.
Machine Learning
The gradient boosted decision trees model trained on Principal Rio Marker disaggregated ODA was able to predict forest cover loss rates fairly accurately in Madagascar between 2016 and 2019.
Given the urgency of protecting Madagascar’s priceless biodiversity, carbon stocks, and natural capital, this model could play a critical role in determining both how much environmental ODA countries should provide to Madagascar and how such ODA should be prioritized.
- The y-axis shows the annual growth rate of deforestation.
- The green line represents the actual observed growth rate of deforestation during the training period.
- The solid orange line represents observed levels of growth in deforestation (i.e. tree cover loss) during the test period.
- The dotted orange line tracks the model’s predictions of growth in deforestation rates.
Key Focus: The closer the dotted orange line is to the solid orange line, the better the model was able to predict growth in deforestation using ODA data.
Click on the button to load the content from datawrapper.dwcdn.net.
Conclusion and Next Steps
The modelling exercise presented in this blog post serves as a showcase of the potential impact the use of machine learning could have in understanding potential linkages of policy design and socio-economic and environmental impact, and supporting more evidence-based allocation of scarce public financing flows with sustainability and national development goals in mind.
Exploratory models with only 10 years of annual training data were able to produce, in the case of some countries, surprisingly accurate predictions of yearly deforestation growth. In others, despite higher errors in actual predictions, trends in deforestation growth rates were still able to be captured. Crucially, models such as these could be used to better inform policymakers and budget planners.
While the predictions of a machine learning model should never be taken as fact, they could prove immensely useful in running scenario analyses, where different provisional budgets could be run through a model trained on historical budgets to gain insights on the directionality and magnitude of effects on various environmental and socio-economic indicators. Machine learning could become yet another tool in policy-makers’ arsenal to make better informed decisions on how spending decisions could impact the environment, and by extension understand the sustainability of national socio-economic trajectory and course-correct if necessary.
A more comprehensive pilot study in collaboration with a national government using historical budget data would serve as a valuable next step in exploring this innovative method of transforming public finance decision-making.
References
[1] The triple planetary crisis: Forging a new relationship between people and the earth (UNEP)
[2] Green fiscal policies for a sustainable and resilient COVID-19 recovery (GFPN)
[3] Global Recovery Observatory (Oxford University Economic Recovery Project)
[4] Are we on track for a green recovery? Not Yet (UNEP)
[5] The triple planetary crisis: Forging a new relationship between people and the earth (UNEP)
[6] Half of World’s GDP Moderately or Highly Dependent on Nature, Says New Report (WEF)
[7] Artificial Neural Network Application in Gross Domestic Product: Forecasting an Indonesia Case
[8] Application of artificial neural networks for testing long-term energy policy targets
[9] Economic Nowcasting with Long Short-Term Memory Artificial Neural Networks (UNCTAD)
[10] Economic Nowcasting with Long Short-Term Memory Artificial Neural Networks (UNCTAD)
[11] Economic Nowcasting with Long Short-Term Memory Artificial Neural Networks (UNCTAD)
[12] Gradient boosting machines, a tutorial (Frontiers in Neurorobotics)
[13] Gradient boosting machines, a tutorial (Frontiers in Neurorobotics)
[14] Gradient boosting machines, a tutorial (Frontiers in Neurorobotics)
[15] Gradient boosting machines, a tutorial (Frontiers in Neurorobotics)
[16] Gradient boosting machines, a tutorial (Frontiers in Neurorobotics)
[17] Ordinary Least Squares Regression (Encyclopedia.com)
[18] Understanding Random Forest. How the Algorithm Works and Why it Is So Effective
[19] Understanding Random Forest. How the Algorithm Works and Why it Is So Effective
[20] Applications of Random Forest (OpenGenus)
[21] Applications of Random Forest (OpenGenus)
[22] The triple planetary crisis: Forging a new relationship between people and the Earth (UNEP)
[23] Short guide to the use of Rio markers (EU)
[24] GeoBook: ODA by sector – bilateral commitments by donor and recipient (OECD)
[25] Aid activities targeting Global Environmental Objectives (OECD)
[26] Global Deforestation Rates & Statistics by Country (GFW)
[27] CBD Strategy and Action Plan – Zambia (CBD)
[28] GLOBAL WILDLIFE PROGRAM PROJECT: Zambia Integrated Forest and Sustainable Land Management Program (World Bank)
[29] Zambia – Main Details (CBD)
[30] An Appraisal of Forest Resources in Zambia using the Integrated Land Use Assessment (ILUA) Survey Data
[31] An Appraisal of Forest Resources in Zambia using the Integrated Land Use Assessment (ILUA) Survey Data
[32] Zambia Deforestation Rates & Statistics (GFW)
[33] Zambia Deforestation Rates & Statistics (GFW)
[34] Environment | Zambia (USAID)
[35] Zambia Takes the Keys Away from ‘Drivers’ of Deforestation (World Bank)
[36] Zambia Takes the Keys Away from ‘Drivers’ of Deforestation (World Bank)
[37] Environment | Zambia (USAID)
[38] Haiti Biodiversity and Tropical Forest Assessment (USAID)
[39] Haiti Biodiversity and Tropical Forest Assessment (USAID)
[40] After the earthquake: Haiti’s deforestation needs attention (Christian Science Monitor)
[41] From Saint Domingue to Haiti: some consequences of European colonisation on the physical environment of Hispaniola
[42] Haiti Deforestation Rates & Statistics (GFW)
[43] Forests and the Forestry Sector: Haiti (FAO)
[44] Potential environmental benefits from woodfuel transitions in Haiti: Geospatial scenarios to 2027
[45] Charcoal Production through Distillation of Wood, perhaps the Key to the Deforestation of Haiti
[46] First post quake assessment in Haiti finds hunger spike in affected area (FAO)
[48] Haiti Biodiversity and Tropical Forest Assessment (USAID)
[49] Haiti Biodiversity and Tropical Forest Assessment (USAID)
[50] 2010 Haiti earthquake (Encyclopedia Britannica)
[51] 2016 Hurricane Matthew: Facts, FAQs, and how to help (World Vision)
[52] DR Congo: Post-conflict environmental assessment (UNEP)
[53] Agricultural and forestry trade drives large share of tropical deforestation emissions
[54] Agriculture and deforestation in the Democratic Republic of the Congo: A synthesis of the current state of knowledge (CIFOR)
[55] Agriculture and deforestation in the Democratic Republic of the Congo: A synthesis of the current state of knowledge (CIFOR)
[56] Resource management key to nation’s future (UNEP)
[57] Democratic Republic of the Congo | Capacity4dev
[58] AID STATISTICS AT A GLANCE TO AFRICA
[59] AID STATISTICS AT A GLANCE TO AFRICA
[60] Democratic Republic of the Congo – Agriculture
[61] Scale of acute hunger in the Democratic Republic of the Congo “staggering”, FAO, WFP warn
[62] Solomon Islands – Main Details (CBD)
[63] Solomon Islands – Main Details (CBD)
[64] Solomon Islands – Main Details (CBD)
[65] Solomon Islands – Main Details (CBD)
[66] Solomon Islands Deforestation Rates & Statistics (GFW)
[67] Solomon Islands – Main Details (CBD)
[68] THE STATE OF THE SOLOMON ISLANDS BIODIVERSITY FOR FOOD AND AGRICULTURE
[69] Logging ravaging the Solomon Islands’ forests
[70] The State of the Solomon Islands: Biodiversity for Food And Agriculture (FAO)
[71] Logging is ripping apart the Solomon Islands. One man is fighting back. (National Geographic)
[72] Solomon Islands (SPC/GIZ)
[74] REDD+ breathes new life into Pacific forests (SPC)
[75] REDD+ breathes new life into Pacific forests (SPC)
[76] Australia’s development partnership with Solomon Islands (AU DFAT)
[77] Deforestation Fronts (WWF)
[78]Deforestation Fronts (WWF)
[79] Deforestation Fronts (WWF)
[80] Deforestation Fronts (WWF)
[81] CBD Strategy and Action Plan – Liberia (CBD)
[82] Liberia Tropical Forest and Biodiversity Analysis (USAID)
[83]National Strategy for Reducing Emissions From Deforestation and Forest Degradation (Redd+) in Liberia (FAO)
[84] Deforestation Fronts (WWF)
[85] The Liberia-EU Voluntary Partnership Agreement (FLEGT)
[86] Deforestation Fronts (WWF)
[87] How Liberia was helped and hurt by foreign aid
[88] How Liberia was helped and hurt by foreign aid
[89] Climate change and deforestation could decimate Madagascar’s rainforest habitat by 2070
[90] Madagascar Deforestation Rates & Statistics (GFW)
[91] Madagascar Deforestation Rates & Statistics (GFW)
[92] Madagascar Deforestation Rates & Statistics (GFW)
[93] Climate change and deforestation could decimate Madagascar’s rainforest habitat by 2070
[94] Madagascar Deforestation Rates & Statistics (GFW)
[95] Deforestation in Madagascar: Consequences of Population Growth and Unsustainable Agricultural Processes
[96] Deforestation in Madagascar: Consequences of Population Growth and Unsustainable Agricultural Processes
[97] Deforestation in Madagascar: Consequences of Population Growth and Unsustainable Agricultural Processes
[98] Madagascar Overview: Development news, research, data (World Bank)
[99] Madagascar Overview: Development news, research, data (World Bank)


#/media/File:Ensemble_Boosting.svg)