Why put a price on carbon?
To accelerate the transition to net zero greenhouse gas (GHG) emissions, climate change mitigation policy needs to become more ambitious. The shift to net zero can be stimulated through a wide range of policy instruments including regulations, e.g. banning the use of certain polluting assets or activities, tax incentives and subsidies for clean technologies – and carbon pricing (here referring to the pricing of all GHG emissions, including methane and nitrous oxide).
Like other climate policy instruments, carbon pricing strengthens incentives for households and businesses to reduce GHG emissions. But carbon pricing tends to be more flexible than other policy instruments, such as bans, as it leaves households and businesses with a range of choices to cut emissions. This flexibility can help to contain transition costs. The effectiveness of carbon pricing to reduce emissions has been demonstrated in a recent OECD study.
Unlike most other climate policy instruments, carbon pricing comes with the added benefit of generating revenues that can be mobilised to further accelerate the green transition and meet other social and political priorities. Importantly, these revenues can be used to fund social programmes to mitigate some of the impacts of the transition, such as reduced energy and food affordability, or the need to re-skill displaced workers. By changing relative prices, carbon pricing can help attract private sector investments in low-carbon assets, which will be central to reaching climate neutrality goals.
Measuring and monitoring carbon prices
Carbon pricing can take the form of carbon taxes and emissions trading systems. Carbon taxes were first implemented in the Nordic countries in the early 1990s. Tradable GHG emission permits were pioneered by the European Union’s (EU) emissions trading system, in operation since 2005. Carbon taxes and emissions trading systems are explicit forms of carbon prices, as they directly price GHG emissions or a base that is proportional to GHG emissions. Today there are 70 explicit carbon pricing initiatives across the world, at the regional, national and subnational level.
The OECD’s work on Effective Carbon Rates, first published in 2016, takes a broader view of carbon pricing, accounting equally for carbon price signals resulting from fuel excise taxes. Fuel excise taxes are economically similar to explicit carbon prices as the tax that is payable increases proportionally with fossil fuel use and the associated CO2 emissions. While fuel taxes tend to apply narrowly to certain fuels (in particular diesel and gasoline used for road transport, and heating fuels), they are often higher than explicit carbon prices and exist in almost all countries.
Policy responses to the recent energy crisis highlighted the practical relevance of taking a broader approach. While countries typically left explicit carbon prices untouched, many cut fuel taxes, reducing effective carbon prices substantially.
Introducing a new dataset to track carbon prices
The OECD has recently released a new comprehensive dataset and report tracking the extent to which countries price GHG emissions. The new dataset covers effective carbon rates, and also accounts for fossil fuel subsidies that translate into negative carbon prices; the resulting indicator is called the net effective carbon rate. The addition of fossil fuel subsidies has proved timely as policy responses to the energy crisis were not limited to fuel tax cuts, but sometimes included rebates and other cash transfers on fuel purchases.
As well as the 38 OECD member countries, the database covers 33 additional countries, mostly developing and emerging economies. Spanning 71 countries, six economic sectors and multiple energy product categories, it allows for detailed analysis of net effective carbon rates in both 2018 and 2021, expressed in local currencies or euros and in real or nominal values. The dataset can help researchers and policy makers to track changes in net carbon prices within and across countries, and identify opportunities for reform.
For the first time, the dataset accounts for GHG emissions other than CO2 emissions from energy use. This enables the monitoring of price developments on a wider set of emission sources such as those from agriculture, cement production and fugitive emissions from the energy industry. The dataset now accounts for approximately 80% of global GHG emissions. For comparison, the previous vintage of the dataset (Effective Carbon Rates 2021) covered less than 60% of global GHG emissions.
What can we learn from the new dataset?
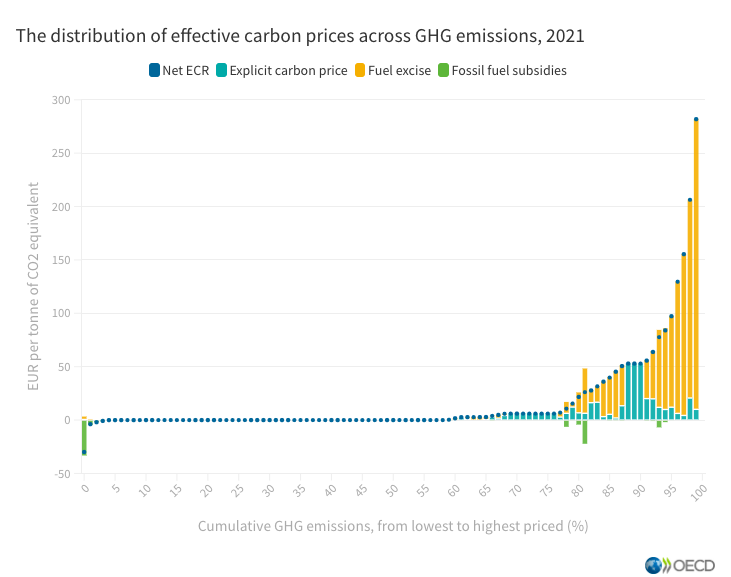
There are important differences in the extent to which governments price carbon – for around 60% of greenhouse gas emissions the net effective carbon rate (Net ECR) is zero or even negative (Figure 1).
Figure 1: 60% of greenhouse gas emissions are taxed at an effective rate of zero or less

Note: The Net ECR is zero for emissions that are neither covered by positive carbon prices (explicit carbon prices and fuel excise taxes) nor subject to fossil fuel subsidies. Alternatively, it can be zero where fossil fuel subsidies are applied to the same emitters as positive carbon prices, and these subsidies fully offset carbon prices. The Net ECR is negative where, for instance, fossil fuel subsidies (negative carbon prices) exceed positive carbon prices (e.g. taxes and emissions trading systems).
Carbon prices and coverage vary widely across countries. Differences partly reflect different carbon mitigation approaches as each country adapts their climate mitigation policy mix to fit their specific circumstances. Each policy instrument also has its own strengths and limitations, and a policy mix allows countries to harness complementarities among different policy measures.
The highest net effective carbon rates tend to be the result of relatively high fuel taxes for road transport. CO2 emissions from industry and power, and other GHG emissions are usually mostly priced by emissions trading systems or carbon taxes, at lower rates than road fuels, or remain entirely unpriced. As a result, the average Net ECR for these three sectors is lower than for the other sectors (Figure 2).
Figure 2: Average effective carbon prices (left axis) and GHG emissions (right axis), by sector, all 71 countries

Expanding coverage to sectors and users currently benefitting from relatively low rates (base broadening) can play a role in reducing emissions and raising revenues. Industry, power and other GHGs – the three sectors with the lowest Net ECRs – are also the sectors with the highest GHG emissions.
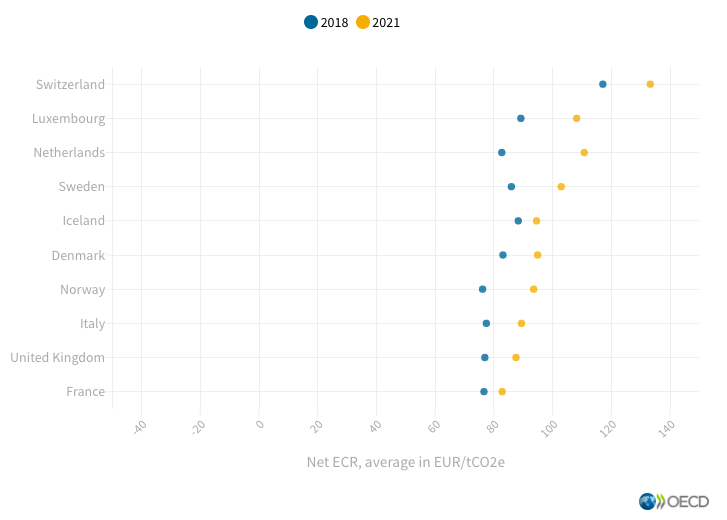
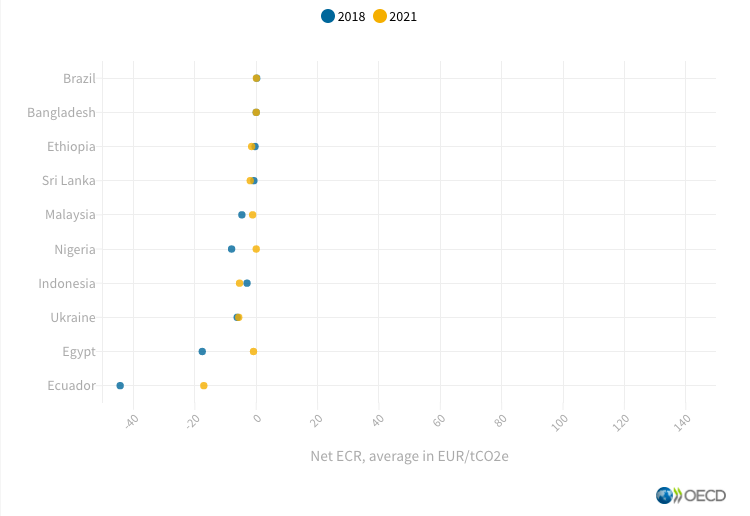
In recent years, larger price increases occurred in countries where carbon prices were already high (Figure 3), suggesting that differences in the extent to which countries rely on carbon pricing as a tool to combat climate change are likely to persist or even increase.
Figure 3: Increasing asymmetries in carbon prices (Net ECR)
Carbon prices increased in all 10 of the countries with the highest prices in 2018

Carbon prices only increased in half of the 10 countries where prices were lowest

Data and key findings can be further explored with the help of an interactive dashboard.
Looking ahead
While carbon pricing can be an effective policy instrument, it is just one of several potential climate mitigation policy instruments that countries can deploy. Even in those countries where carbon pricing is widely used, it is unlikely to be enough on its own to achieve net zero GHG emissions, and will therefore need to be part of a broader policy package.
In this context, countries will continue to use a mix of policy tools to meet climate goals, with some countries putting a greater emphasis on carbon pricing than others. This development highlights the importance of improved data and analysis – going beyond carbon pricing – to obtain a more complete picture of countries’ climate mitigation strategies. This is the focus of the Inclusive Forum on Carbon Mitigation Approaches (IFCMA), which held its inaugural meeting in early February 2023 and which will take stock of the diverse approaches that countries adopt in their quest to cut greenhouse gas emissions.
By Jonas Teusch (Jonas.TEUSCH@oecd.org), Konstantinos Theodoropoulos (Konstantinos.THEODOROPOULOS@oecd.org) and Astrid Tricaud (Astrid.TRICAUD@oecd.org), Centre for Tax Policy and Administration (OECD)
Click here to read the original blog on OECD


